 Image 1 of 3
 Image 2 of 3
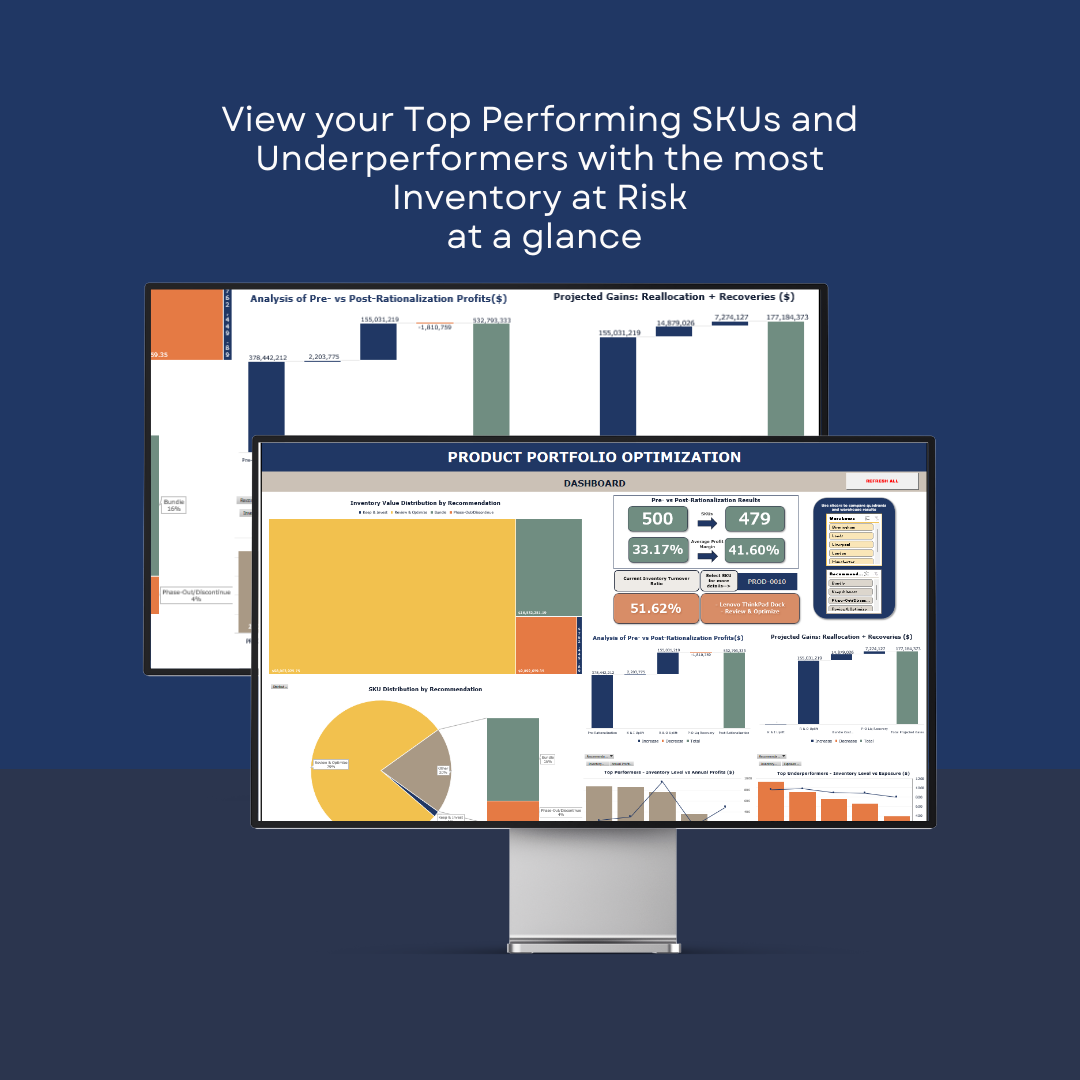 Image 3 of 3
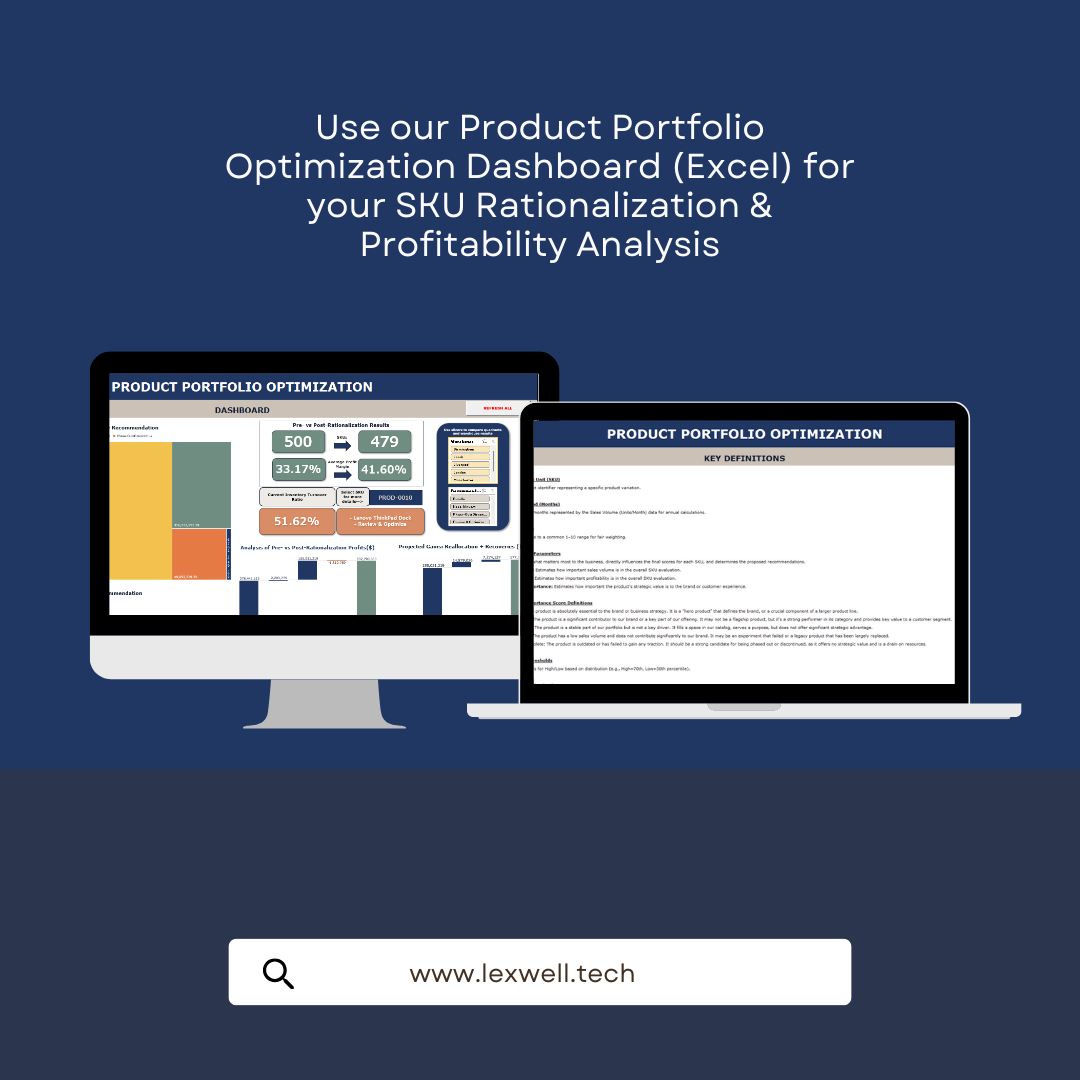
Product Portfolio Optimization Dashboard (Excel) – SKU Rationalization & Profitability Analysis


Streamline your product portfolio with the Product Portfolio Optimization Dashboard (Excel Digital Download) — a powerful tool for retail, eCommerce, and supply chain teams in North America and Africa.
With this dashboard, you can:
Evaluate SKU performance: Track sales volume, profit margin, inventory value, and strategic importance of each SKU.
Identify underperforming products: Pinpoint SKUs to keep, optimize, bundle, or phase out based on profitability and strategic fit.
Analyze profitability impact: Calculate current vs. projected revenue, profit, and margin after rationalization.
Visualize insights with dashboards & heatmaps: See portfolio health and SKU decisions at a glance.
Make data-driven decisions: Align product mix with customer demand, supply chain efficiency, and business growth.
Perfect for retail brands, eCommerce startups, CPG companies, and consultants who need to cut costs, boost margins, and simplify product portfolios.
FAQs
1. What is the Product Portfolio Optimization Dashboard?
An Excel-based tool that analyzes SKU performance, highlights underperforming products, and supports rationalization decisions to improve profitability.
2. Who should use this template?
Built for retailers, eCommerce brands, CPG companies, and consultants who need to simplify product portfolios in North America and Africa.
3. What data can I track?
Sales volume & profit margins
Inventory levels & values
Strategic importance scores
Revenue & profit impact of rationalization actions (keep, optimize, bundle, phase out)
4. Is it customizable?
Yes — fully customizable in Excel to reflect your own rationalization rules, thresholds, and reporting needs.
5. Do I need advanced Excel skills?
No — the template is plug-and-play, with prebuilt dashboards, heatmaps, and formulas.
6. How will I receive the template?
Delivered as a digital download — instant access after purchase.